From doing business intelligence to creating intelligent business


Download the case study of fast growing car retail chain

The promise of data guiding your decisions and improving your organization’s performance is instilled in your mind – and now you’re taking up on it.

That’s great.

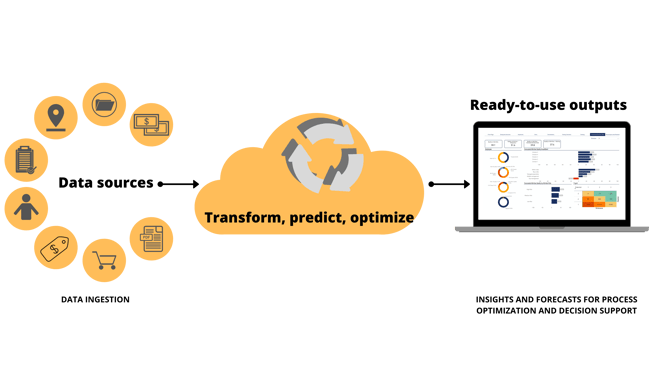
Reporting automation and data visualization is the premise of any modern BI solution. That in and of itself helps to save time, money and lessen even the possibility of errors.

However, when you link metrics to key decision-making points in your organization’s processes the data begins to guide your decisions – and help you to improve organization’s performance. From strategy to implementation.

That’s creating intelligent business.

And with all the basics in place you’re set to further your analytics journey by applying advanced analytics and optimization.

Contact.001


”After helping us to choose modern BI tool and creating a basis for our reporting we are still in the beginnig of our data journey. We have created dynamic reporting that serves business and business processes. Our next step is to implement advanced analytics and optimization into reporting.”

Atria Finland

Customer references

kamux_logo

Azure environment, Power BI service

Growing car sales business with better insights and market understanding. 

+5000 cars and +60 stores in Finland, Sweden and Germany.

1-2

Azure environment, Power BI service

Implementing basis for data-driven decision making with business intelligence.

Optimizing packing and dispatching operations with CPLEX in Azure.

CPG customer

Power BI service

Implement analytical process as a part of business management. The goal was to set accurate sales targets based on data.

With new system the company  is able to sell best products and right amount for each customer. 

Improve business outcomes

Automated reporting

Forget time-consuming manual work. Gain automated update process, minimizing errors and reducing costs

Fast time-to-insights

Interactive and intuitive dashboards that are always up to date, accessible anytime and anywhere

Better decisions based on data

Insights fed to key decision-making points for all stakeholders


Improved organizational performance

Shared tools, goals and metrics

How to start your intelligent business journey


At times people talk about data culture. But what is it?


It’s a fancy term for a simple principle: Data is for everyone. Same data can be used by multiple stakeholders in an organizational setting – for multitude of different insights.


When people have access to data everywhere it fosters the culture, providing insights where decisions are made. That benefits entire organization and its performance.


How forecasting-as-a-service works


Identify your current situation with data culture and reporting

Identify decision-making points in your process

Use modern BI for everyday data-driven business decisions

We've prepared a simple guide that helps you to get your first business intelligence project off the ground. 


Get the guide.001

BI services


Contact.001


BI Proof-of-Concept

Challenge
  • What BI tool suits us best?
  • What our data can do for us?
  • How to automate data processes?
  • How to implement data culture?
Solution
  • Project is delivered in two weeks with 1-3 data sets: Preparing a production-ready BI solution, documentation, plan for production.
Result
  • Help to choose future BI tool
  • Understand the current business situation based on real data
  • Data understanding for the future projects
  • New BI solution in production

Administering and monitoring modern BI service

Challenge

  • Without agreed ground rules and monitoring BI environment easily turns into uncontrollable mayhem 
  • How to control self-service BI environment that has many players with different skill background
  • Regulation set up challenges. 

Solution

  • Implement ground rules of developing, publishing and consuming reports
  • Monitor report usage and performance
  • Monitor taken actions
  • Create alerts to ease up administering BI environment
Results
  • Manageable BI environment
  • Report development best practices
  • Easy self-service BI
  • Better performance
  • Regulation follow up


Administering and monitoring Power BI service

Solution includes
  • Environment analysis and review
  • Set up monitoring and administering features
  • Analyze workspace, data model and report performance
  • Analyze on-premise server
  • Usage metrics

Results

  • Environment documentation
  • Set up alerts for administrators
  • Plan of actions based on findings
  • Follow up of the agreed changes


Tableau Server Health Check

Solution includes
  • Set up server monitoring and gathering of historical data
  • Analyze server performance
  • Analyze extract schedules and performance
  • Analyze report and data model performance and usage metrics

Results

  • Environment documentation
  • Plan of actions based on findings
  • Follow up of the agreed changes
  • Implementation of maintenance tasks

BI-as-a-Service

Challenge

  • From comfort zone to discomfort zone
  • What is possible with our data
  • Where to find resources - skills and time
  • Outsourced or in-house development
  • How to ensure BI tool implementation and utilization

Solution

  • BI solution as a service
  • BI consult as a service
  • BI training sessions

Results

  • BI implementation plan and training
  • Production ready solutions
  • Solution maintenance and development 
  • Improved resource allocation
  • Improved BI skills
  • Knowledge transfer

POS analytics


Discover all the insights in your sales channel performance. Transform your POS data into actionable insights. 

POS analytics preview - Houston Analytics

See POS analytics

People Analytics

Unlock the true potential of your workforce data. Discover all the insights throughout the employee lifecycle. 


People Analytics Platform - Houston Analytics

See People Analytics - Houston Analytics


Download the case study